
API Reference
Logging & Monitoring
Meebly provides comprehensive monitoring tools to track agent performance, debug issues, and ensure reliability. Use PingMate for uptime monitoring, Traces for detailed execution analysis, and Logs for real-time debugging.
- • PingMate: View and manually test all API requests made by agents
- • Traces: Deep dive into individual agent executions
- • Logs: Real-time debugging and action execution history
PingMate - Request Inspector & Testing Tool
PingMate is a Postman-like tool built into Meebly that captures all HTTP requests your agents make and allows you to inspect, modify, and manually re-execute them. It's perfect for debugging agent behavior and testing API endpoints.
What PingMate Does
Request Recording
Automatically captures every API call your agent makes, including method, URL, headers, and payload
Manual Execution
Modify and re-run any request manually to test different parameters, headers, or payloads
Response Comparison
Compare the agent's original request response with your manual test runs side-by-side
CURL Export
Copy any request as a CURL command to test in your terminal or share with your team
Using PingMate
PingMate is available in the sandbox view when testing agents:
- Navigate to the Sandbox tab in your agent's dashboard
- Start a conversation with your agent that triggers API calls
- Click the "PingMate" tab to see all recorded requests
- Select a request to inspect its details
- Modify the method, URL, headers, or payload as needed
- Click "Execute Request" to test your changes
- Compare the results with the original agent-made request
Key Features
- Full Request Details: View method, URL, headers, and payload for every request
- Edit and Re-run: Modify any part of a request and execute it manually
- Response Inspection: See both the agent's original response and your manual test results
- Timing Information: Track how long each request takes
- JSON & Form-Data Support: Handle both application/json and multipart/form-data payloads
- CURL Generation: Export requests as CURL commands for external testing
Traces - Execution Analysis
Every agent execution generates a unique trace that captures the complete execution flow. Traces show you exactly what happened during an agent interaction, including all actions called, reasoning steps, and timing information.
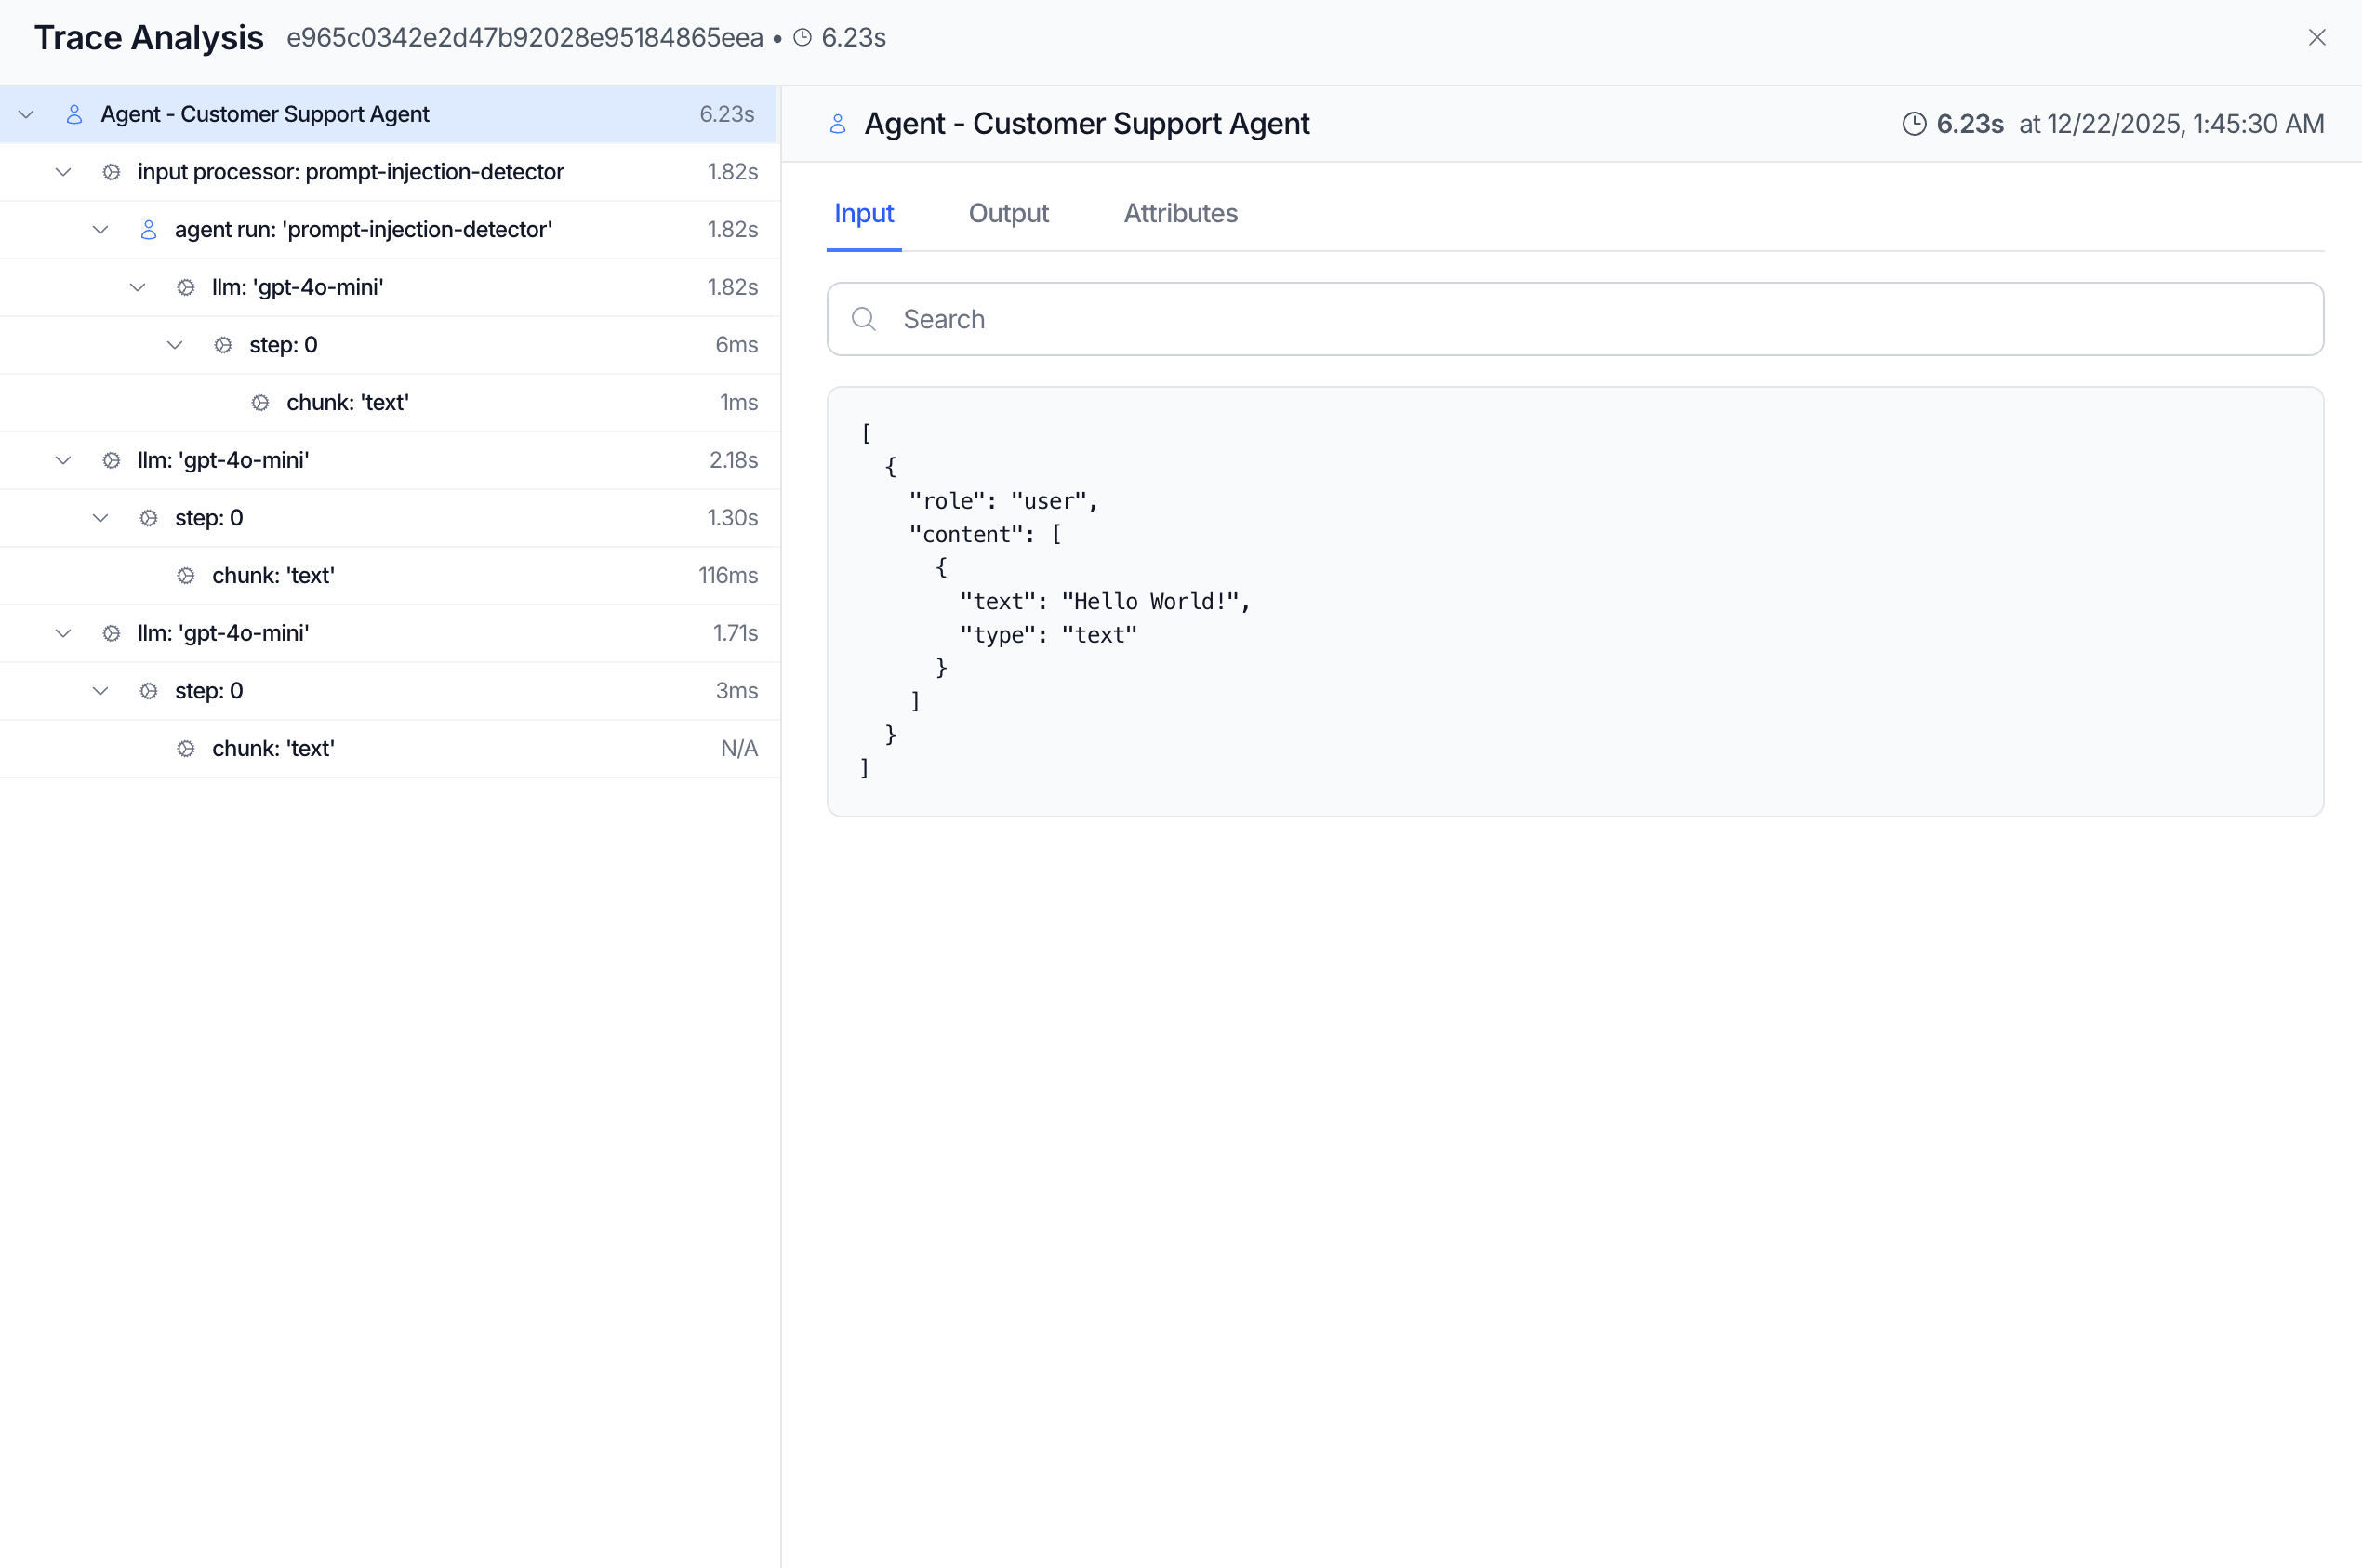
Trace IDs
Every agent execution returns a traceId in the complete event. Save this ID to review the execution later in the dashboard or include it when reporting issues to support.
// Complete event with traceId
{
  "type": "complete",
  "data": {
    "text": "Your order has been created!",
    "threadId": "thread_abc123",
    "traceId": "trace_xyz789"  // Save for debugging
  },
  "isComplete": true
}
What Traces Include
Each trace captures comprehensive execution details:
| Data Point | Description |
|---|---|
| Actions Called | Complete list of actions executed, their parameters, and results |
| Timing Information | Execution time for each step and total duration |
| Agent Reasoning | Decision-making process and why specific actions were chosen |
| Input Context | User messages, screen state, and custom instructions |
| Errors & Failures | Any errors encountered with full stack traces |
| Model Calls | LLM requests, token usage, and response times |
Using Traces for Debugging
To debug an issue, capture the traceId from your application and look it up in the Meebly dashboard:
// Capture traceId in your application
if (event.type === 'complete') {
  const traceId = event.data.traceId;

  // Log it for debugging
  console.log('TraceID:', traceId);

  // Store it in your system
  await logToDatabase({
    traceId,
    threadId: event.data.threadId,
    userId: currentUser.id,
    timestamp: new Date().toISOString()
  });

  // Show it to users for support tickets
  if (hasError) {
    showMessage(`Something went wrong. Reference: ${traceId}`);
  }
}Logs - Real-time Debugging
Access detailed execution logs through the API response and real-time log channels for live debugging during development and production troubleshooting.
Action Execution History
The complete event includes executedTools - a detailed log of all actions the agent called during execution:
{
  "type": "complete",
  "data": {
    "text": "I've processed your order",
    "executedTools": [
      {
        "toolName": "validateInventory",
        "success": true,
        "executionTime": 245,
        "result": {
          "inStock": true,
          "quantity": 50
        }
      },
      {
        "toolName": "createOrder",
        "success": true,
        "executionTime": 890,
        "result": {
          "orderId": "order_123",
          "status": "confirmed"
        }
      },
      {
        "toolName": "sendConfirmationEmail",
        "success": false,
        "executionTime": 1200,
        "error": "SMTP connection timeout"
      }
    ],
    "threadId": "thread_abc",
    "traceId": "trace_xyz"
  }
}
Use executedTools to:
- Identify which action failed in a workflow
- Audit agent actions for compliance
- Understand agent decision-making patterns
- Track API usage and performance per action
- Optimize slow-running actions
Real-time Live Logs
View live logs in real-time directly in the Sandbox tab while testing your agents. Live Logs stream execution details as they happen, giving you instant visibility into agent reasoning, action selection, and API calls.
What Live Logs Show:
- • Agent reasoning and decision-making steps in real-time
- • Semantic action filtering results
- • Action selection and parameter extraction
- • API call details (request/response)
- • Execution timing for each step
- • LLM token usage and costs
- • Errors and warnings as they occur
Live Logs are automatically enabled in the Sandbox and require no additional configuration. They provide the same detailed execution information you'd get from programmatic logging, but displayed in an easy-to-read interface perfect for development and debugging.
Action Execution Scoring
Set logToolScore: true to enable analytics on action performance:
- Success/failure rates per action
- Average execution time and latency distribution
- Action selection accuracy (was the right action chosen?)
- Parameter extraction quality
- Agent optimization insights and recommendations
Debugging Workflow
Follow this workflow to effectively debug agent issues:
Capture the TraceID
Always log the traceId from every execution for future debugging.
if (event.type === 'complete') {
  console.log('TraceID:', event.data.traceId);
  logToYourSystem({
    traceId: event.data.traceId,
    threadId: event.data.threadId,
    timestamp: new Date().toISOString()
  });
}Check Executed Actions
Review which actions ran and identify failures.
const failedActions = event.data.executedTools.filter(
  action => !action.success
);

if (failedActions.length > 0) {
  console.error('Failed actions:', failedActions);
  failedActions.forEach(action => {
    console.error(`${action.toolName} failed: ${action.error}`);
  });
}Review the Trace in Dashboard
Look up the traceId in the Meebly dashboard to see the full execution flow, including agent reasoning, action selection, and detailed error messages.
Monitor in PingMate
Check PingMate to see if this is an isolated issue or part of a larger pattern. Look for spikes in error rates or latency.
Monitoring SSE Events
For detailed debugging during development, log all SSE events to understand agent behavior in real-time:
// Log all events for debugging
const reader = response.body.getReader();
const decoder = new TextDecoder();
let buffer = '';

while (true) {
  const {value, done} = await reader.read();
  if (done) break;

  buffer += decoder.decode(value, {stream: true});
  const lines = buffer.split('\n\n');
  buffer = lines.pop() || '';

  for (const line of lines) {
    if (line.startsWith('data: ')) {
      const event = JSON.parse(line.slice(6));

      // Log everything for debugging
      console.log('SSE Event:', {
        type: event.type,
        event: event.event,
        timestamp: Date.now()
      });

      // Handle specific events
      if (event.type === 'meebly-event') {
        if (event.event.type === 'tool-call') {
          console.log('Action called:', event.event.payload.toolName);
        } else if (event.event.type === 'tool-result') {
          console.log('Action result:', event.event.payload);
        }
      }
    }
  }
}